Tutorial: Summing Sources
This article provides a step-by-step tutorial for summing multiple sources and analyzing their combined response.
The simulation in this tutorial has already been set up and run so you don't have to do so again.
Overview
Analyzing the combined response of multiple sources is of critical importance in many design projects. Treble allows you to easily sum sources, after a simulation has been ran. This means that you don't have to know before running a simulation what sources you want to sum, making analysis and design quicker and more streamlined.
Of note is that the wave based solver and image source method in Treble are pressure based and take phased based information into account, both for a single source and the summed response. You can therefore use Treble to analyze e.g. the constructive and deconstructive interference of correlated and uncorrelated reflections.
Setup
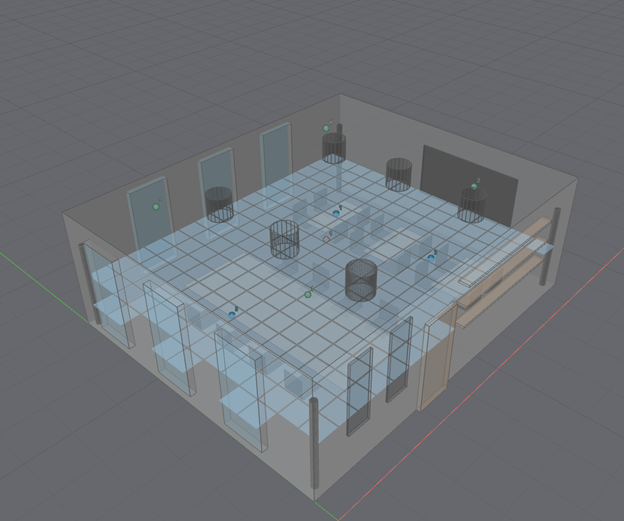
In this tutorial we're going to look at a small restaurant space and analyze the sound pressure level distribution from four ceiling speakers. In this section an overview will be given of the setup.
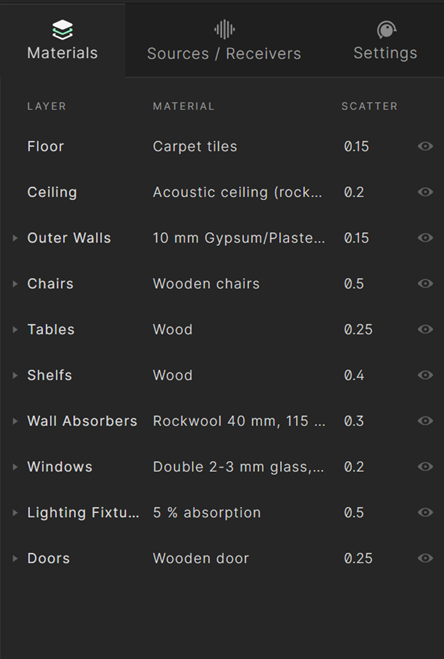
The materials and scattering values assigned to the surfaces in the room can be seen in the material section on the right:
Selecting the Source/Receivers tab shows the ceiling speakers used for this case, four Martin Audio speakers:
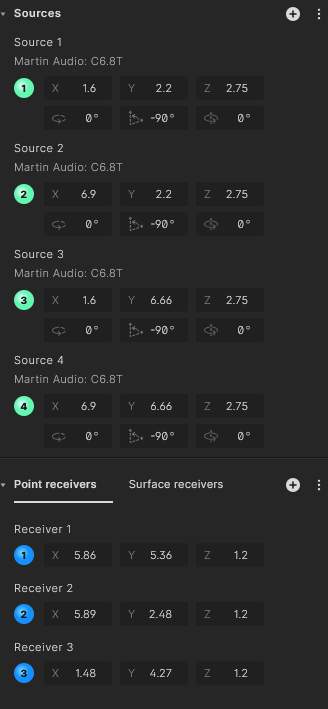
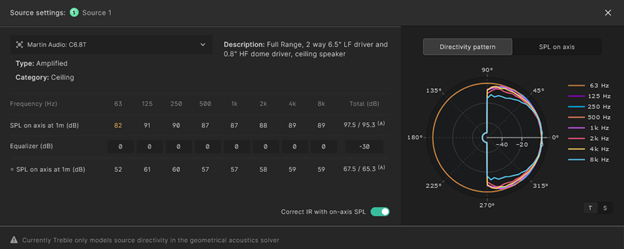
Hovering over a source will show the source settings window:

Select it to see the source settings menu, in which you can see the directivity of the source and the on-axis sound pressure level. Note that in this case all the speakers have been given an eq of -30 dB:
Three point receivers and a surface receiver grid have also been predefined.
Individual Source Results
Select the results icon in the bottom right to analyze the simulation results:

Here you can look at the acoustical parameters for each individual source. Feel free to browse between different parameters before continuing.
This tutorial will focus on the results within the surface receiver view which can be selected from the top menu.
![]()
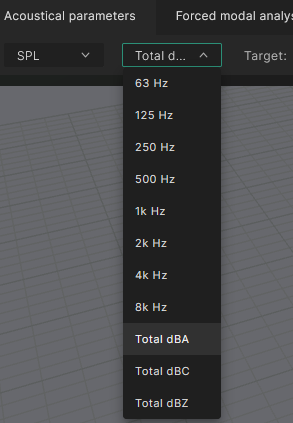
From the parameter dropdown in the top left select 'SPL' and from the octave band dropdown select 'Total dBA'. This will show the total A-weighted sound pressure level, summed across all octave bands.
Your viewport should now look like this:
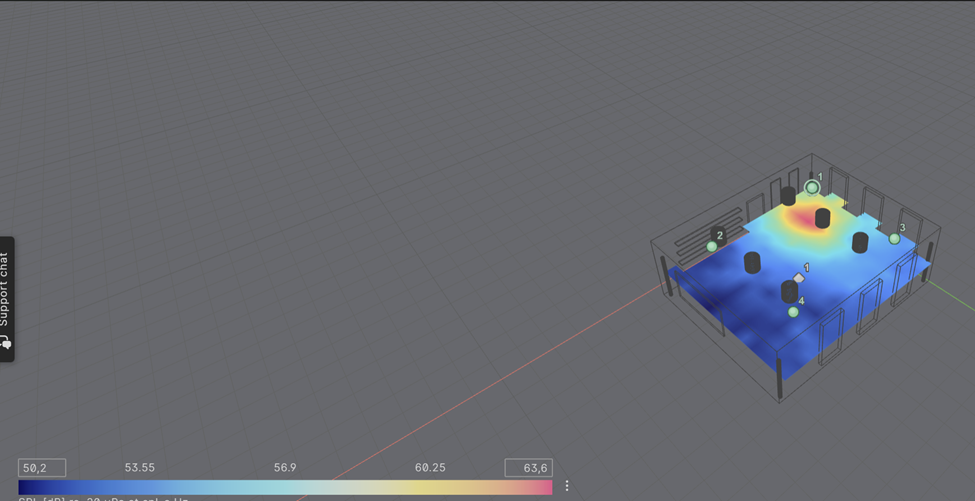
As expected the sound pressure level from a single ceiling speaker is poorly distributed throughout the room.
You can switch between different sources using the field at the bottom:

Try selecting 'Source 2' from the dropdown:
Note that when you switch between sources the legend scale changes. After selecting source 2 it should look like this:
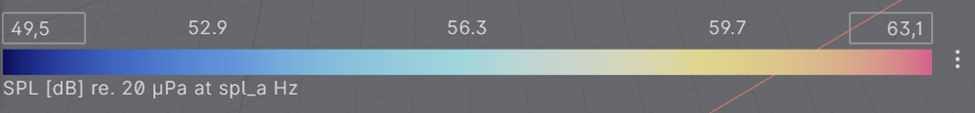
Select the leftmost and rightmost numbers of the legend and write 50 and 65 respectively. This will change the axis and fix it so that it won't change when switching between sources.
Summing Sources
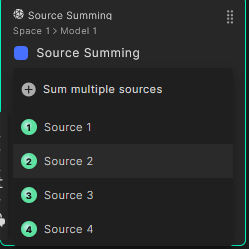
You might have noticed the 'Sum multiple sources' option, above the name of the sources, when changing between individual sources. This option allows you to sum sources and is the highlight of the tutorial. Selecting it opens the following pop-up:
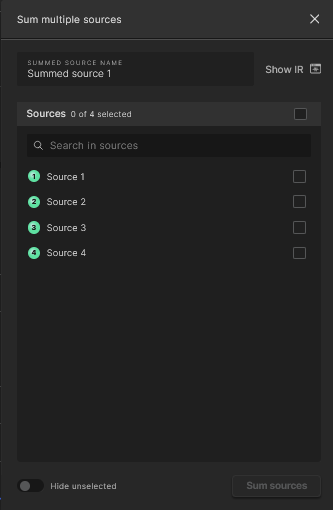
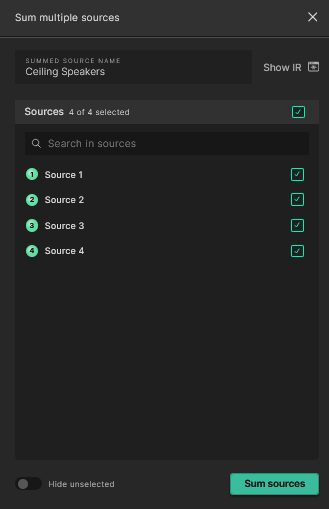
In the first line you can name the group of speakers you're going to sum. By default the names of the individual sources are added together. In this instance change the name to 'Ceiling Speakers':
Then select all of the sources to sum them together. You can either press each checkbox individually or the checkbox next to the 'Sources' label to select all:
Although not a focus of this tutorial, you can also add delay to each source as explained here
Then select 'Sum sources'. This will start the source summing task, it can take up to a minute but you can do other tasks within Treble in the meantime, without interruption.
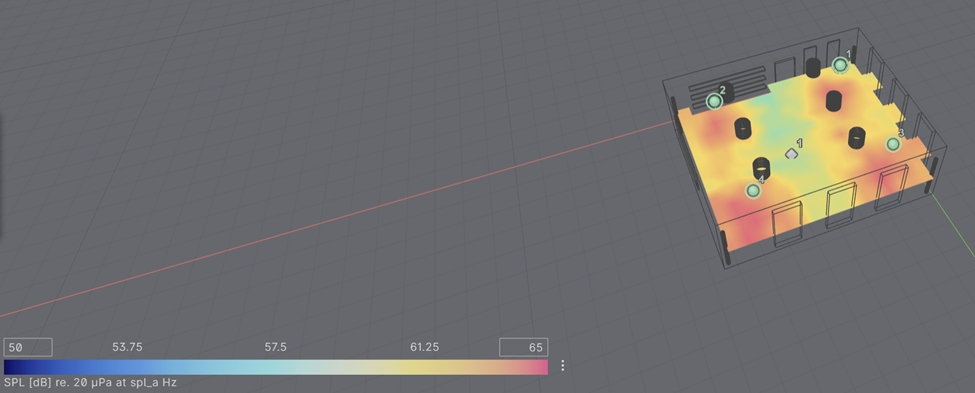
After the summation is done you should see the new summed source in the source dropdown. Select it to analyze the results:

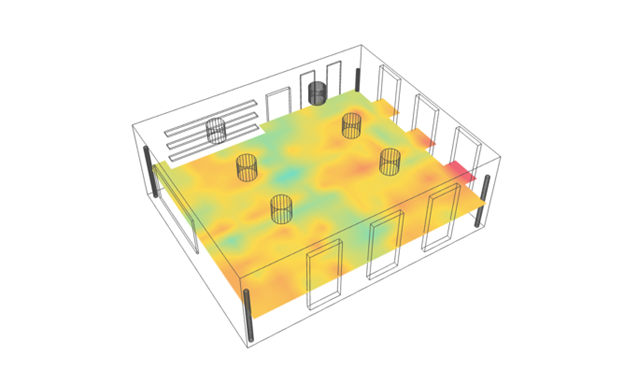
Now you can see the results of the summed response. The SPL distribution over the space has become much more even:
Analyzing Coverage
The final step in the analysis is to look at our SPL coverage in more detail. For that we will use the Target field in the top left:

This field can be used to analyze how a parameter is distributed spatially across a surface receiver, when compared with a reference value or a target range. Select it and then select the Range option:

A possible design target for a relaxed atmosphere is that the sound pressure level from the speaker system is in the range between 60-65 dBA. When inputting these values in the respective text fields we get the following:
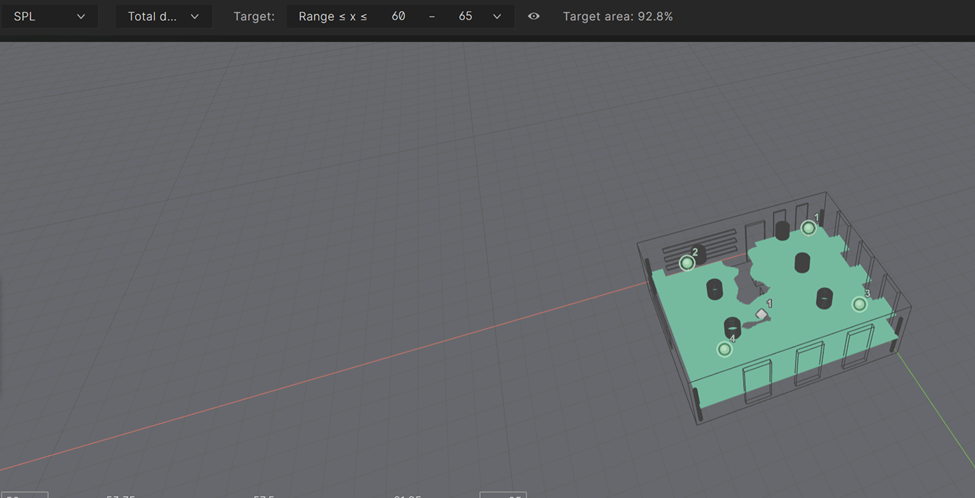
We can see that the condition is met across 92.8 % of the area of the surface receiver, whose area in this case equals the area of the floor. To meet the design target we would have to change the gain on each speaker or add more speakers.
This concludes the tutorial. Feel free to play around with the project, you can try to analyze other parameters or change the simulation setup and run it again to get even more even SPL distribution. This simulation will be stored in a tutorial project in your project view and can be revisited at any time.