Complex lab facility (Part 1): Full bandwidth wavebased simulation
The study measured the capabilities of Treble’s wave-based solver in a medium-sized room of 80 cubic meters. The solver was tested for full-bandwidth up to 8kHz and both mono and binaural room impulse responses (RIR) were measured using a directive source and a KEMAR mannequin at various positions. The simulations were carried out on a cluster with six Nvidia A100 GPU cards running in parallel. Results are compared and presented for Energy Decay Curves and derived acoustical parameters, reverberation time T20 and early decay time, for the mono RIR. The binaural RIR results are compared both in the frequency domain and in the time domain.
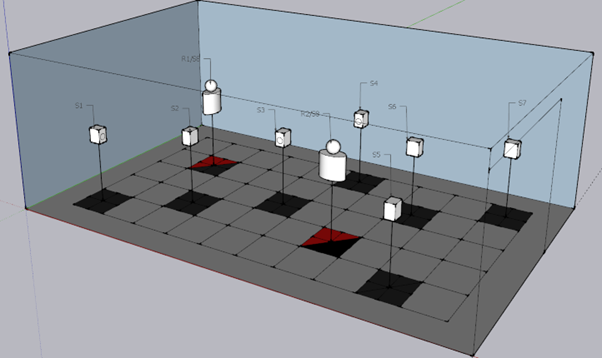
Fig.1 Overview of the source-receiver positions and orientation. For the mono RIR´s the ½” measurement microphone was placed roughly in same position as the center of the KEMAR head would be.
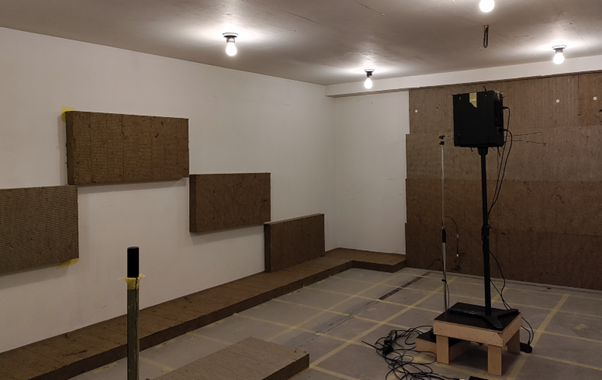
Fig2. Photograph of the measurement room. Most surfaces are concrete, but a 100 mm rockwool absorber has been placed on the walls and floor in various locations.
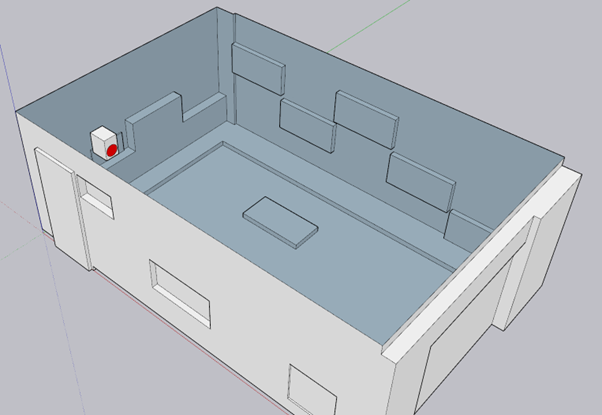
Fig3. Final 3D model with speaker in position 1. The red surface shows the speaker membrane.
The source is modelled by including the geometry of the speaker box directly into the 3D room model, and then apply an impulsive surface velocity excitation to the loudspeaker membrane. Two simulations are performed, one using the larger membrane in the loudspeaker box (up to 3 kHz) and another using the tweeter membrane (3-8 kHz), and the results of these two are merged in post-processing.
The simulations were carried out on a cluster with six Nvidia A100 GPU cards running in parallel. The finite element mesh resolution is set at roughly 1.6 elements per wavelength at the highest frequency of interest (8000 Hz) and fourth order basis functions are used. These settings ensure minimal dispersion errors across the frequency range of interest. The compute time for 0.5 sec impulse response length was around 14 hours.
Results are compared and presented for the Energy Decay Curves and the derived acoustical parameters, reverberation time T20 and early decay time, for the mono RIR. The binaural RIR results are compared both in the frequency domain and in the time domain.
See plots:
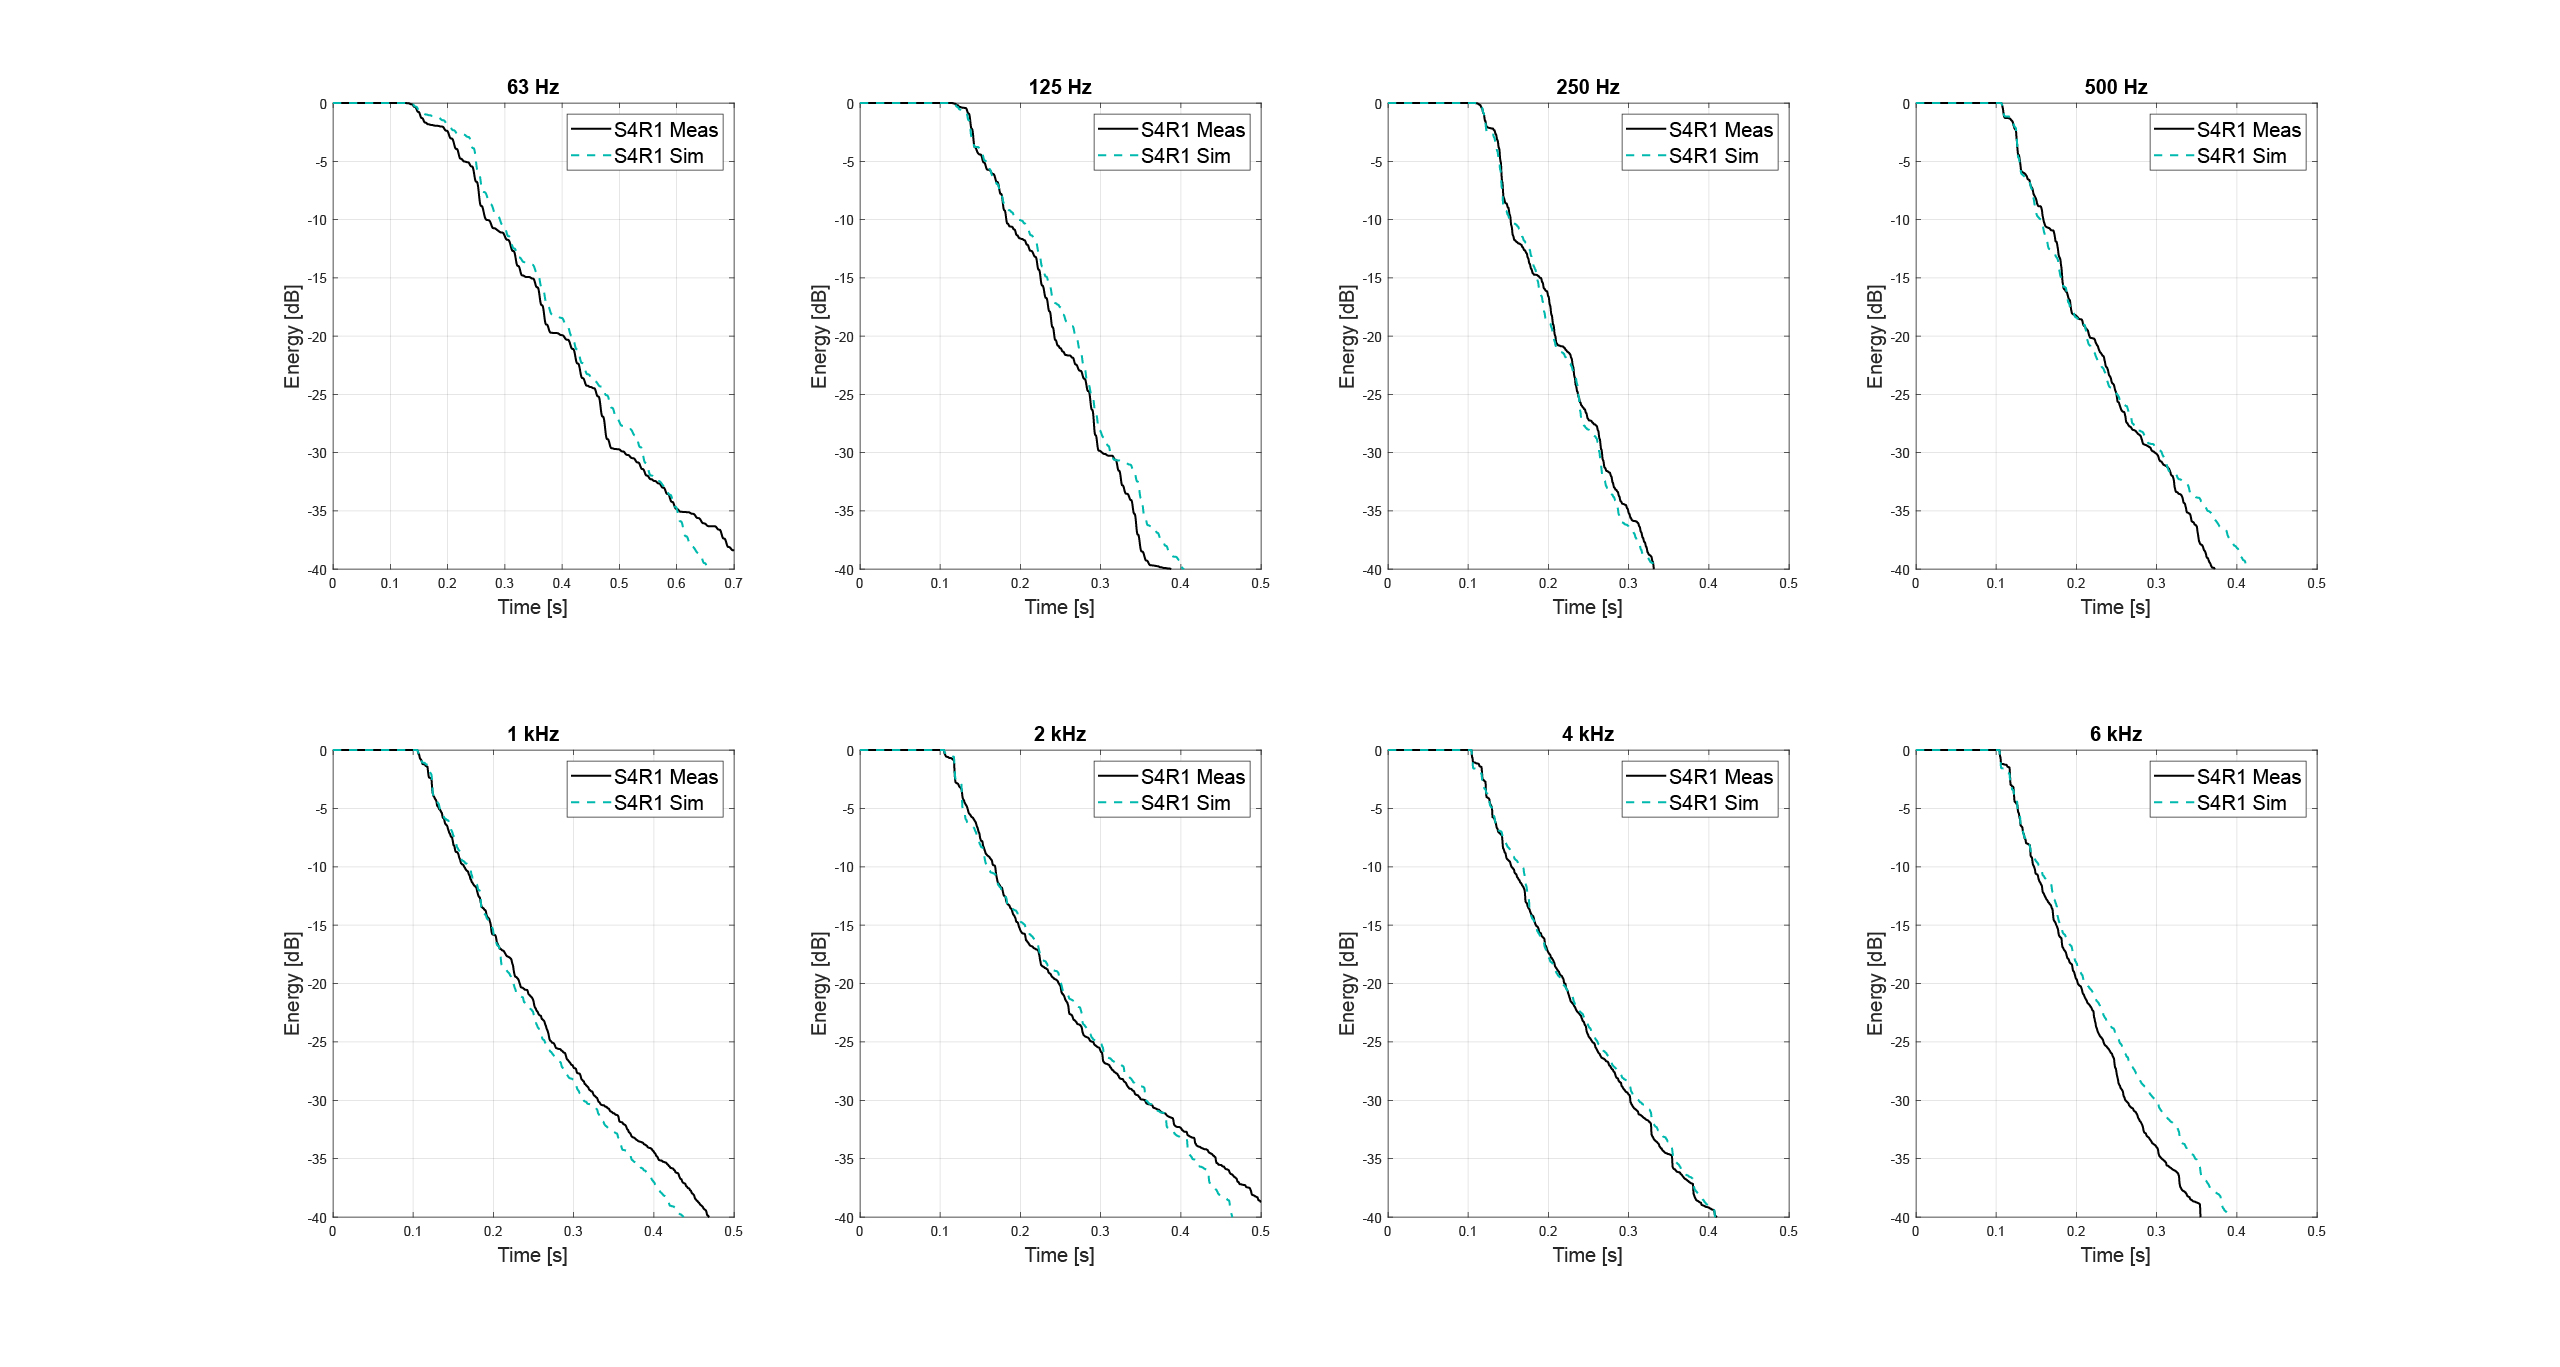 Fig 4. Simulated versus measured energy decay curves for the mono room impulse response in compared in position S4R1.
This plot analyzed the decay of sound waves in the given room. The Y-axis represents the energy level in decibels (dB). The X-axis represents time in seconds. In this plot, we have 8 graphs each representing the decay in each octave band in which there is a real-life measurement and a simulated measurement. Each graph shows very close similarities in results between measured data and simulated data. This suggests that the simulation model is accurate and can be used to predict the behavior of the system under different conditions.
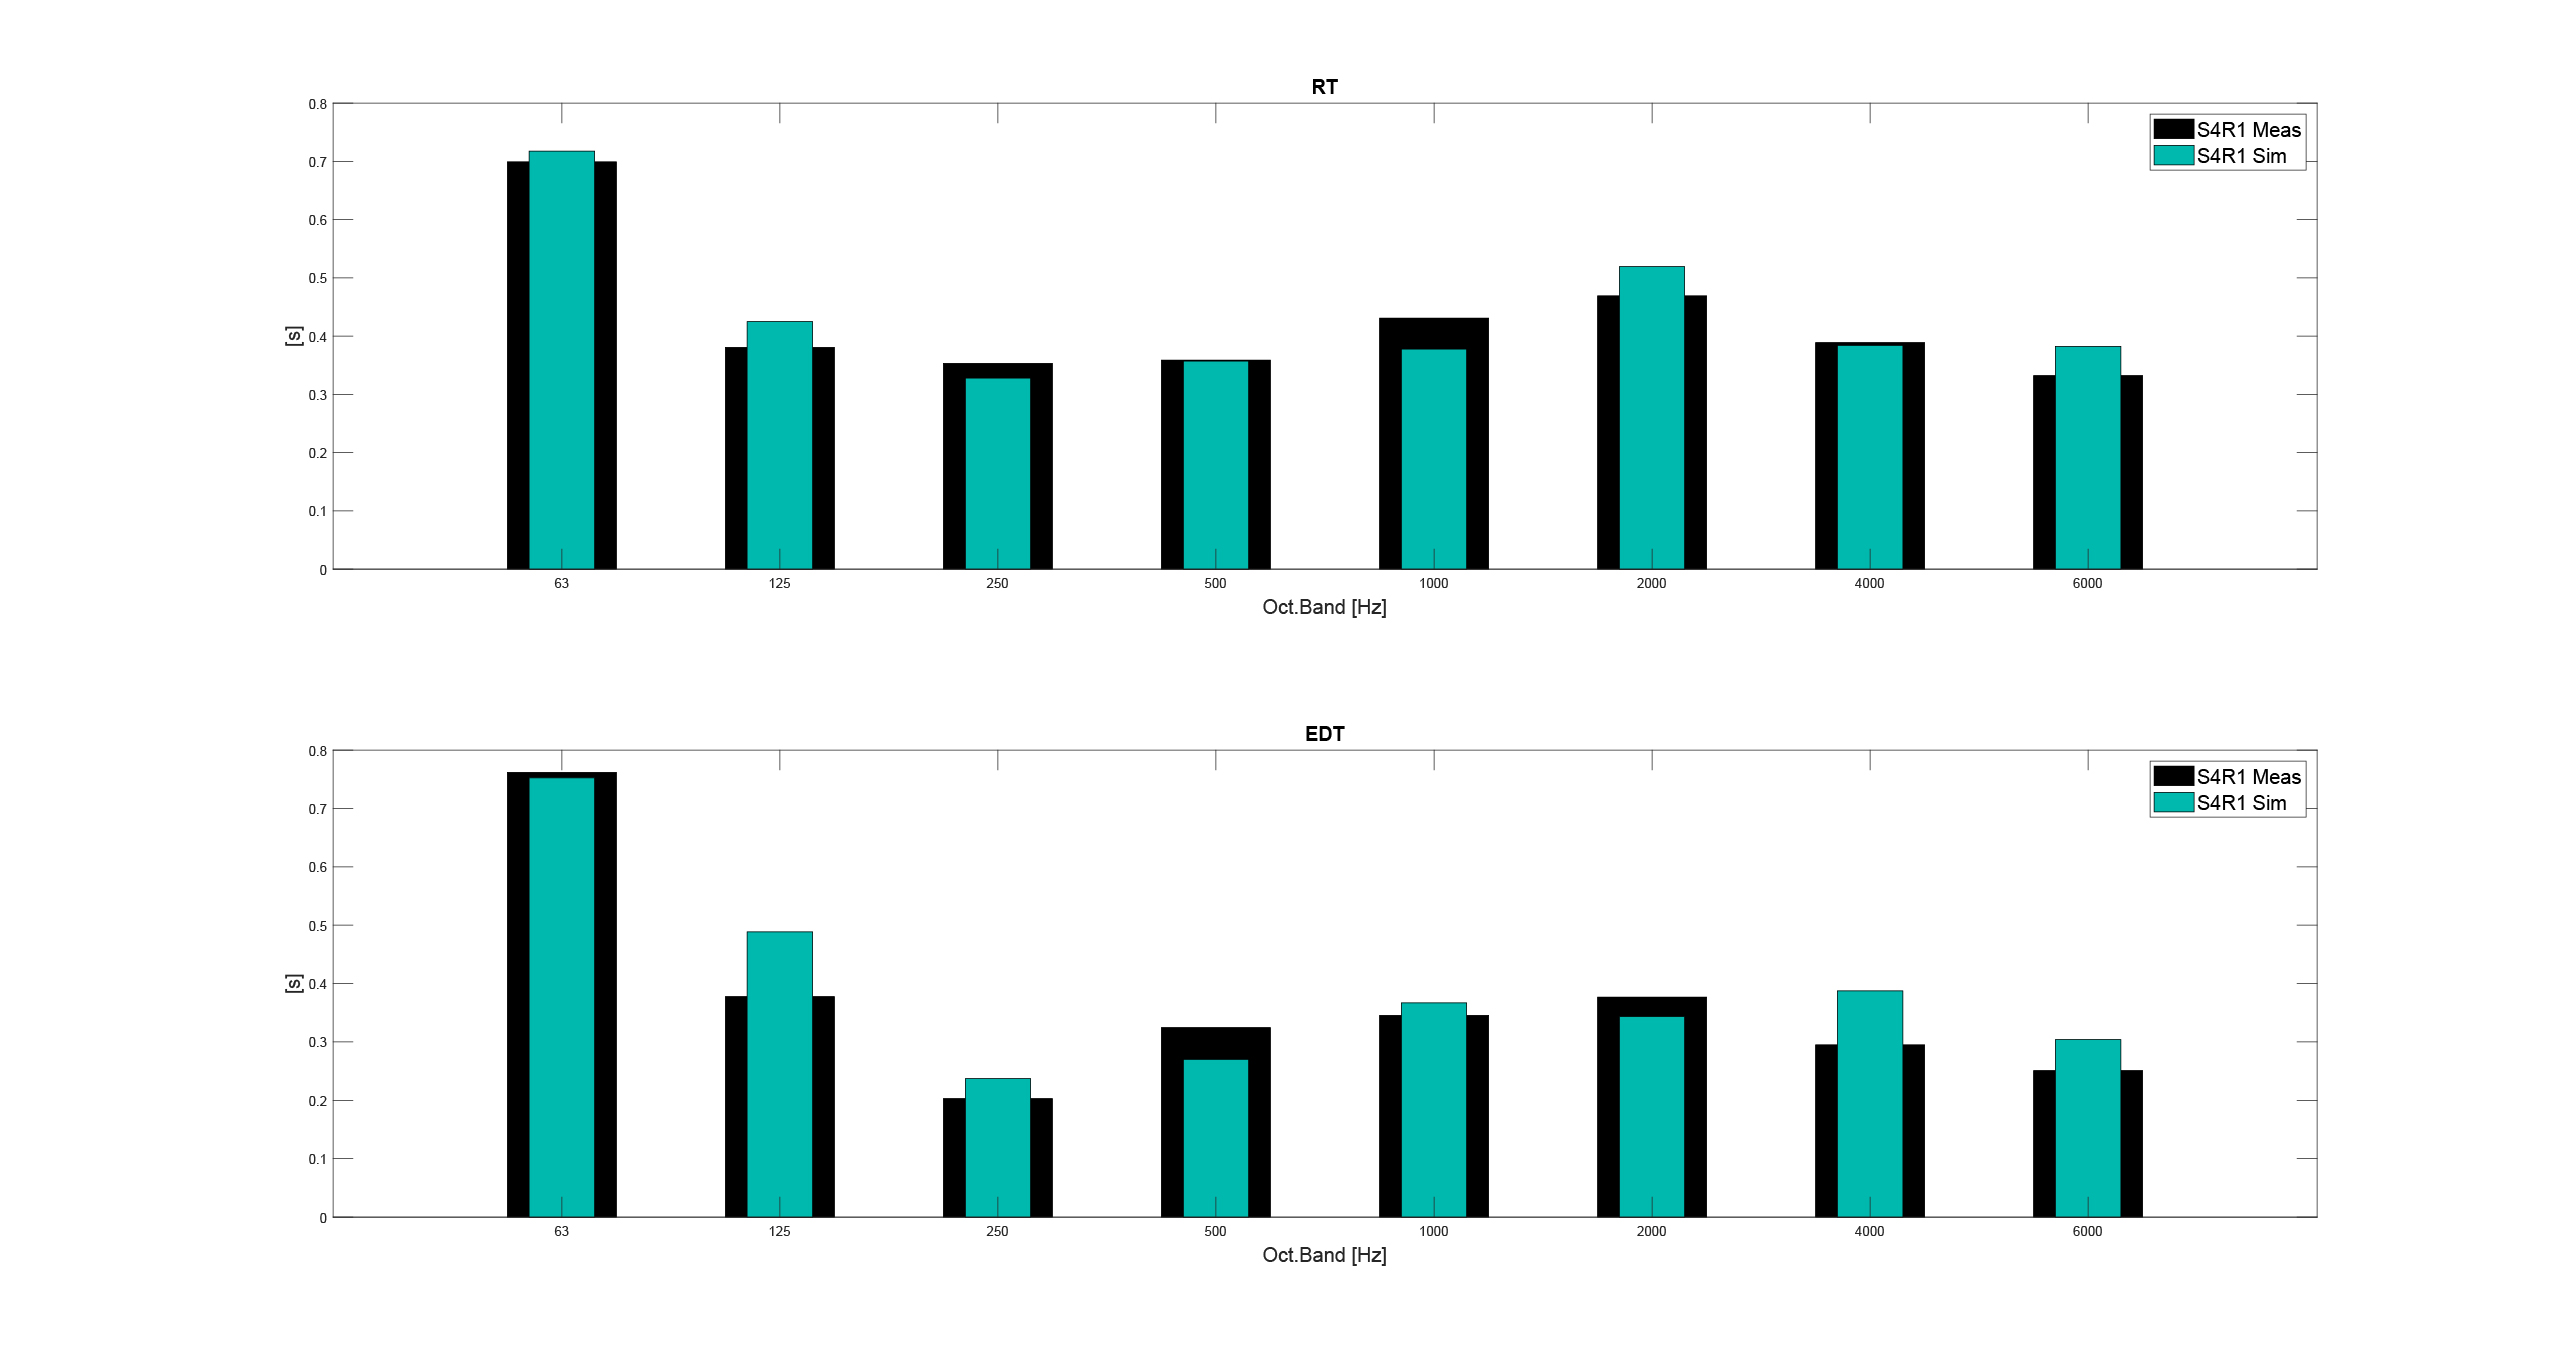 Fig 5. Simulated versus measured frequency response for the left channel of the binaural impulse response compared for position S2R1
This frequency response plot was used to compare the results of the Treble simulation with real-world measurements. The Y-axis represents the normalized magnitude response in dB and the X-axis represents frequency in Hz. The simulation and measurement results match closely, suggesting that the simulation model is accurate and can predict the system’s behavior under different conditions.
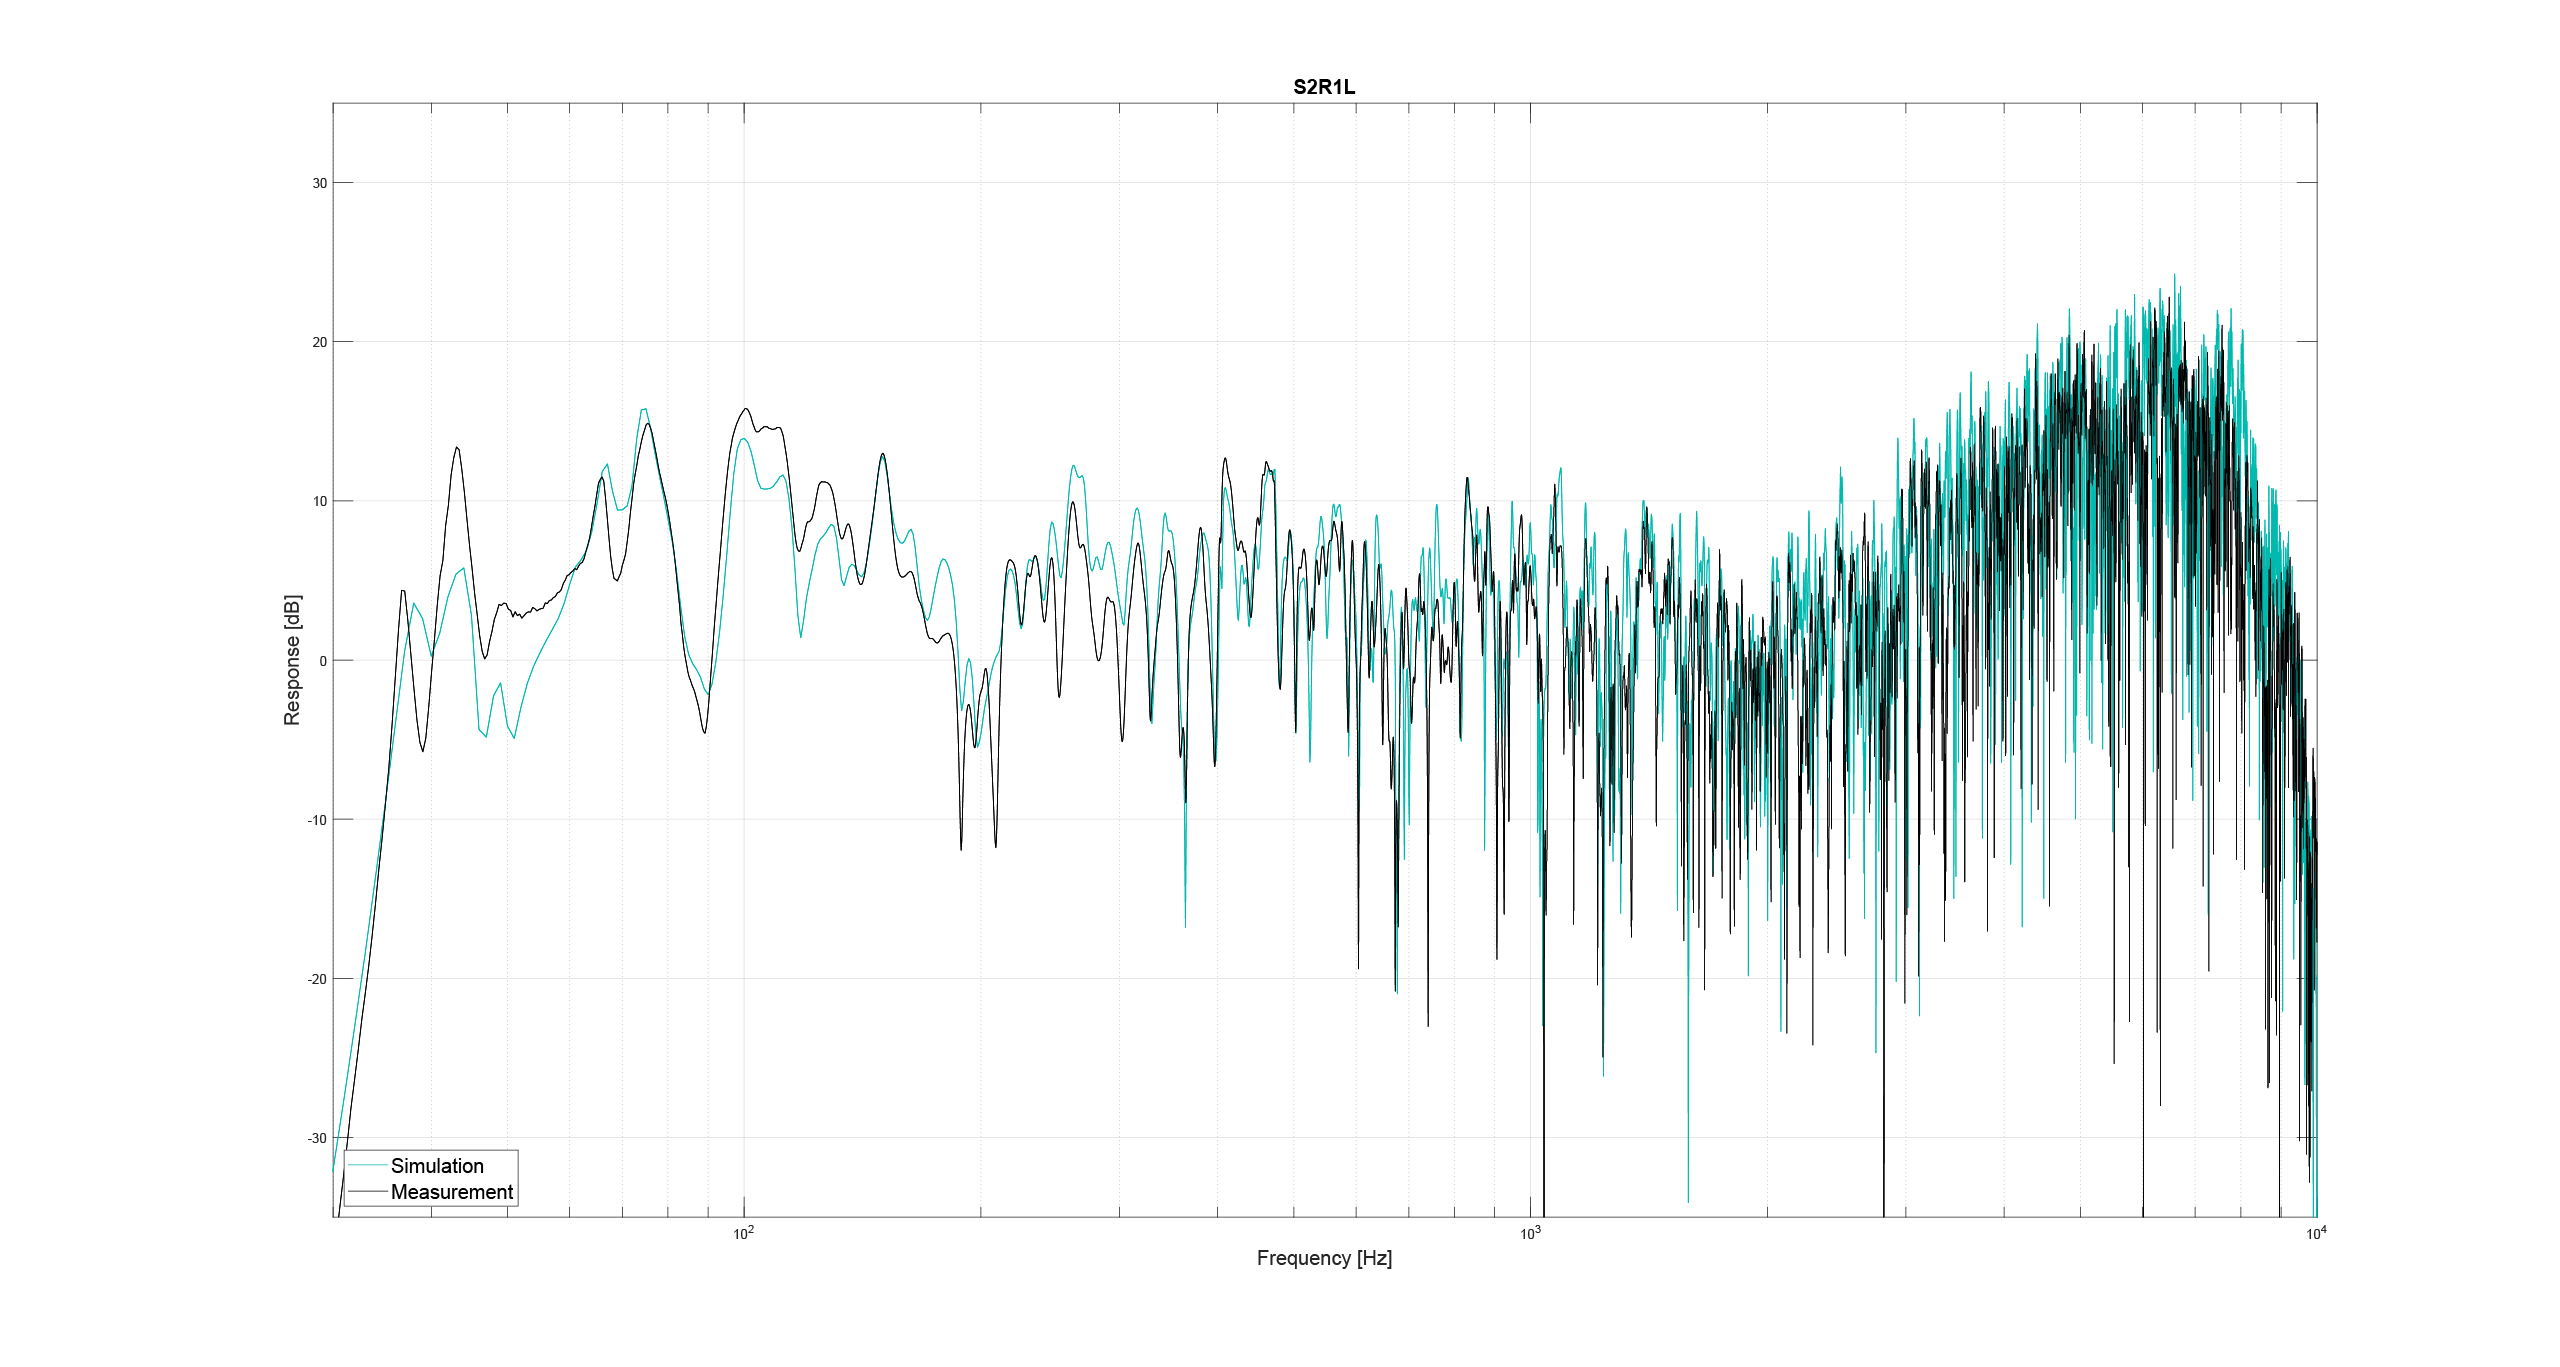 Fig 6. Simulated versus measured room acoustic parameters compared for mono impulse response at position S4R1. Reverberation time T20 above and Eearly Decay Time (EDT) below.
In this acoustic parameter plot we measured:
The reverberation time (the time it takes for sound to decay by 60 dB after the sound source has stopped). It gives information on the diffuse sound decay and is derived from the slope of the energy decay curve between -5 dB and -25 dB below the initial level at different octave bands.
The early decay time (EDT) is derived from the decay curve section between -1 dB and -11 dB below the initial level at different octave bands.
Both RT and EDT are acoustic parameters that are used to assess the acoustic quality of a space. Our findings show very similar results between measurements and simulation, which means that the simulation is accurate and can predict the acoustic quality of a space.
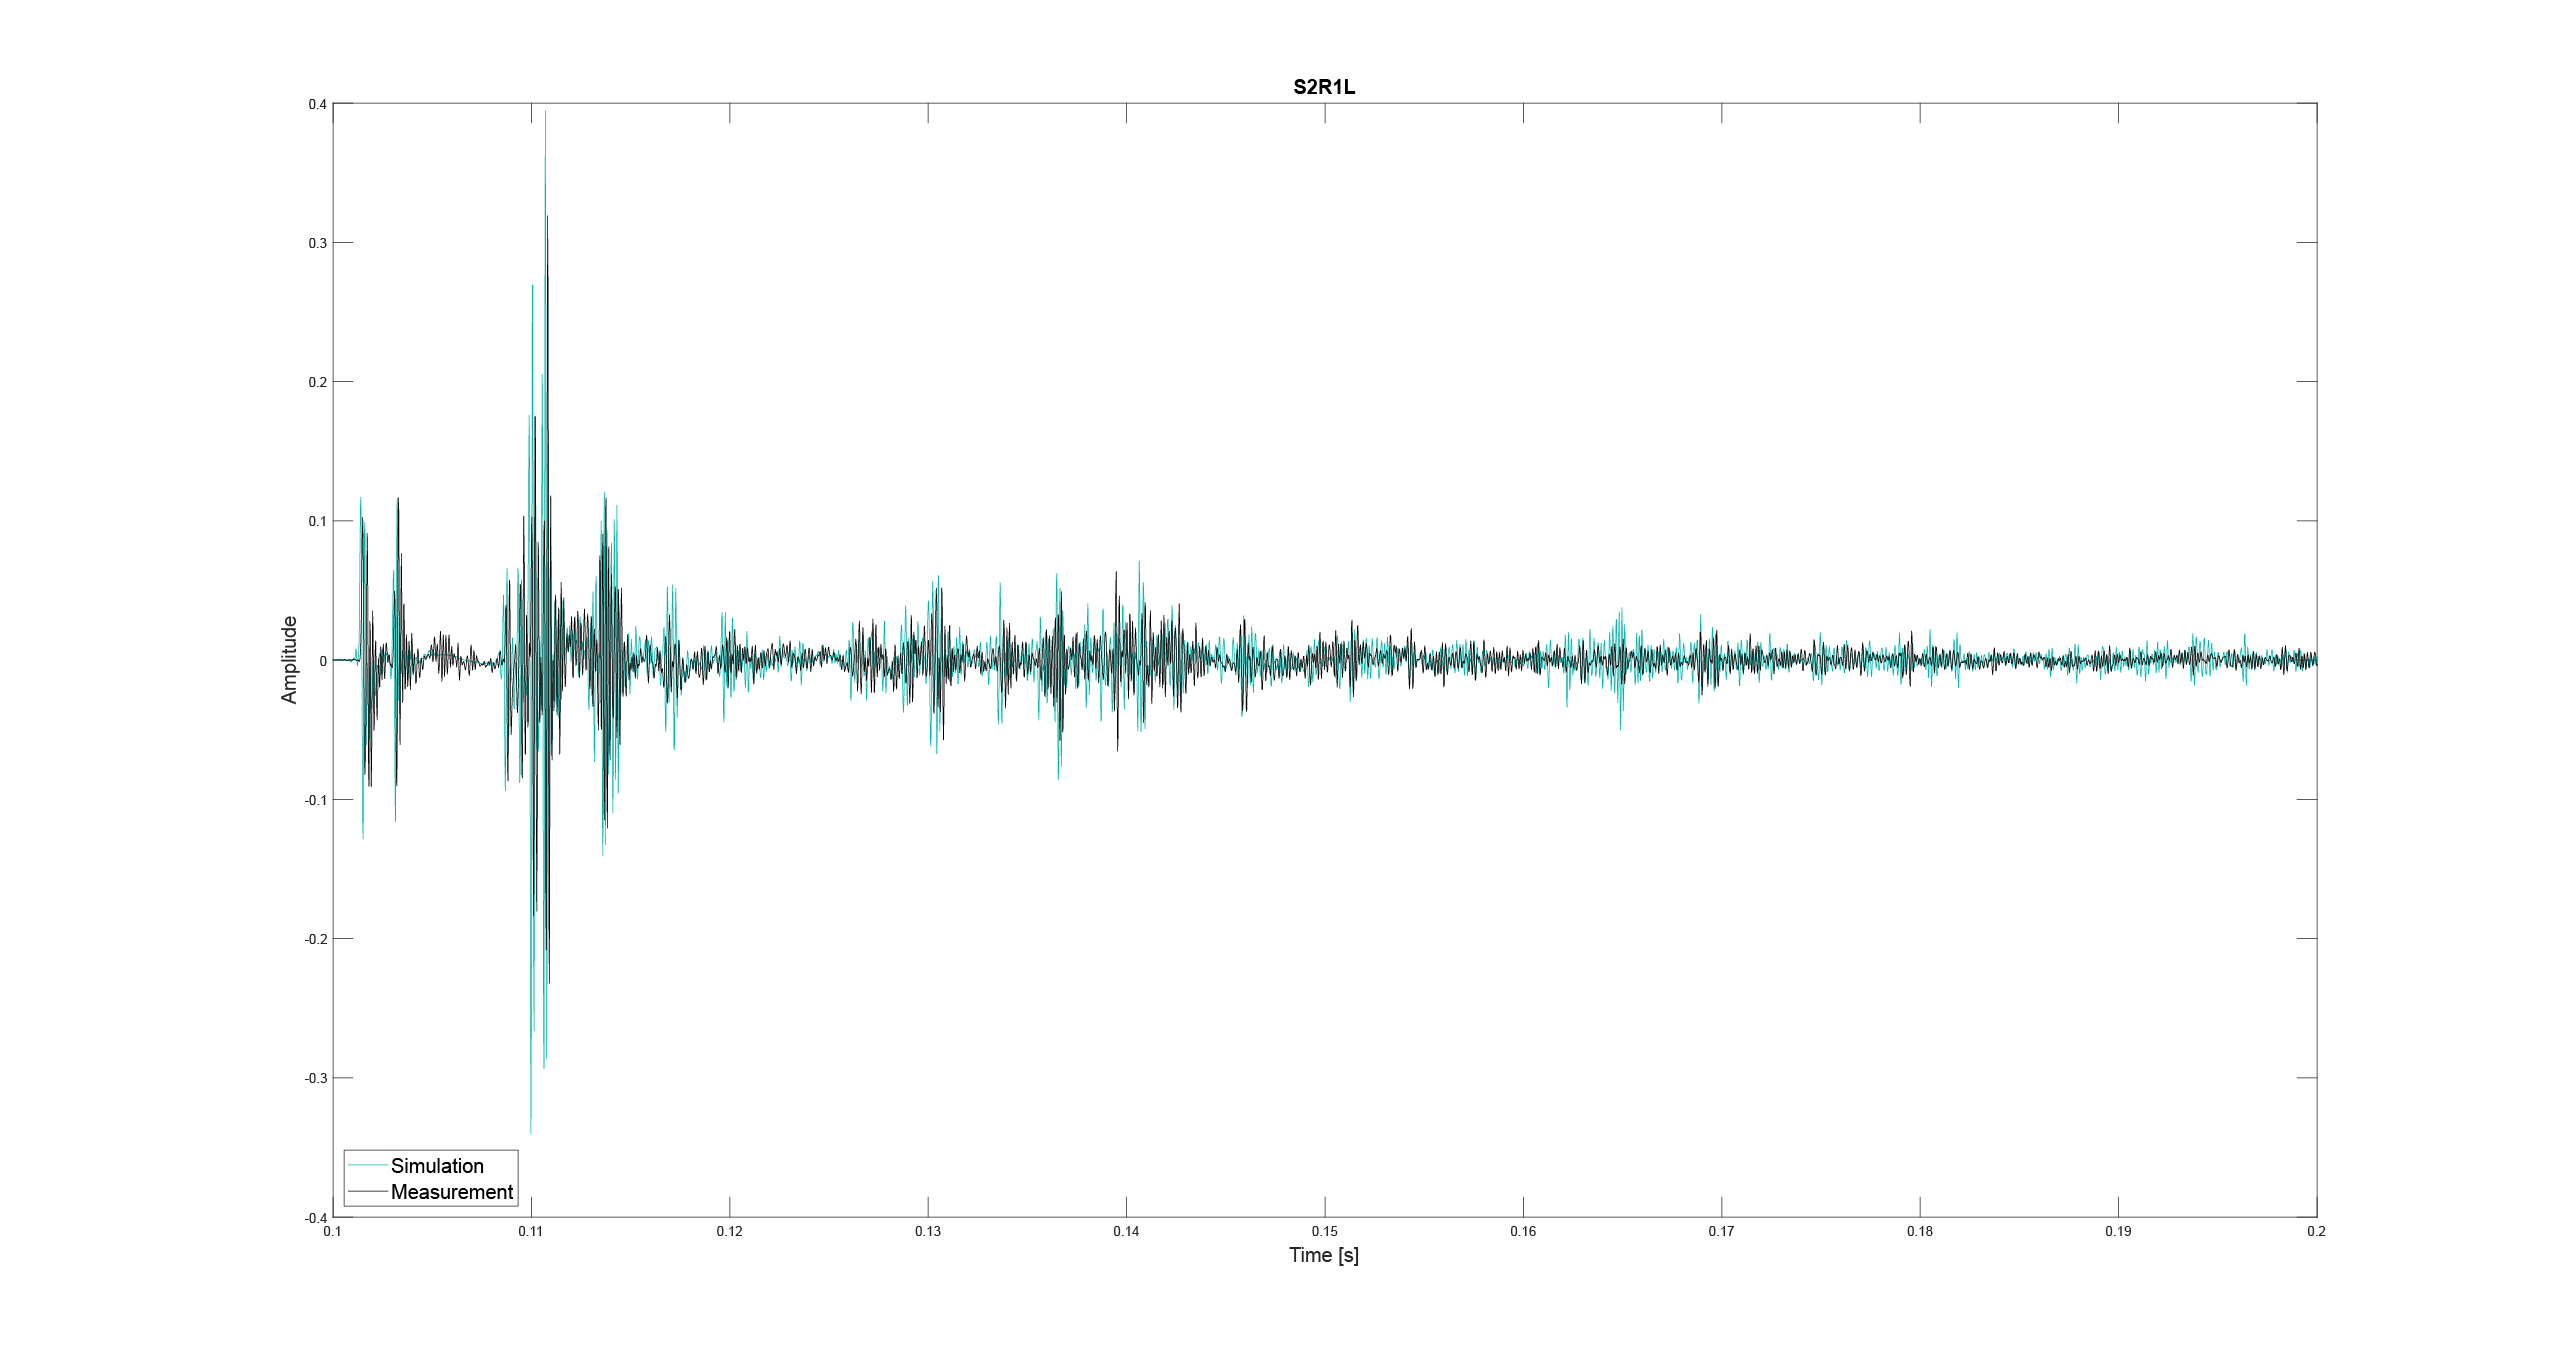 Fig 7. Simulated versus measured impulse response compared for the left channel of the binaural impulse response at position S2R1
This impulse response plot compared the results of the simulation against real-world measurements. The Y-axis represents pressure amplitude, and the X-axis represents time. The simulation and measurement results match closely, suggesting that the simulation model is accurate and can predict the system’s behavior under different conditions.