Crossover frequency
The crossover frequency plays a significant role in the DG and hybrid simulations run in the SDK: For DG-only simulations, the crossover frequency defines the upper limit of the computational domain as well as the element size within the simulations. For hybrid simulations, the crossover frequency defines the upper frequency and element size for the DG solver, as well as the low-pass and high-pass filters used to hybridize the results from the DG results and GA results respectively. To read more about the post-processing applied to hybrid simulations, please visit the page on Hybridization in our Technical Reference.
Example
In the following example, we create a basic simulation and compare the results of the three simulation types.
# define a cubic room of 2 meters per side and add it to the project
room = treble.GeometryDefinitionGenerator.create_shoebox_room(2,2,2,True)
room = project.add_model(model_file_path=room,model_name='2x2x2 room')
# get a generic material with a flat 50% absorption by id and assign it to all layers in the model
genmat = tsdk.material_library.get_by_id('cd5bd674-56bb-4d58-aea8-b8250162c9b5')
material_assignment = [treble.MaterialAssignment(x,genmat) for x in room.layer_names]
# create a source and a receiver
receivers = [treble.Receiver(1,1,1,treble.ReceiverType.mono,"receiver_1")]
source = [treble.Source(0.25,0.5,1.5,treble.SourceType.omni,"source_1")]
# estimate the Sabine reverberation time and calculate the Schroeder frequency
T = room.calculate_sabine_estimate(material_assignment) # Calculate Sabine T30 from the room's material properties
T = T[0] # all frequencies are the same since the material assignment is a flat absorption coefficient
V = 2*2*2 # internal volume
f_schroeder = 2000*np.sqrt(T/V) #calculate Schroeder frequency
# make three identical simulation definitions, changing only the simulation type
sim_def_dg = treble.SimulationDefinition(
name="My DG simulation",
simulation_type=treble.SimulationType.dg,
model=room,
crossover_frequency=720,
energy_decay_threshold=35,
receiver_list=receivers,
source_list=source,
material_assignment=material_assignment
)
sim_def_ga = treble.SimulationDefinition(
name="My GA simulation",
simulation_type=treble.SimulationType.ga,
model=room,
crossover_frequency=720,
energy_decay_threshold=35,
receiver_list=receivers,
source_list=source,
material_assignment=material_assignment
)
sim_def_hyb = treble.SimulationDefinition(
name="My Hybrid simulation",
simulation_type=treble.SimulationType.hybrid,
model=room,
crossover_frequency=720,
energy_decay_threshold=35,
receiver_list=receivers,
source_list=source,
material_assignment=material_assignment
)
# create a list of the simulation definitions and add them to the project
sim_defs = [sim_def_dg, sim_def_ga, sim_def_hyb]
simulations = project.add_simulations(sim_defs)
# run the simulations
for sim in simulations:
sim.start()
# download the results
sim_dg, sim_ga, sim_hyb = simulations
res_dg = sim_dg.download_results(f'./results/{sim_dg.name}',rename_rule=True)
res_ga = sim_ga.download_results(f'./results/{sim_ga.name}',rename_rule=True)
res_hyb = sim_hyb.download_results(f'./results/{sim_hyb.name}',rename_rule=True)
# grab the frequency responses and their corresponding frequency vectors
this_result_dg = res_dg.get_mono_ir(source=sim_dg.sources[0],receiver=sim_dg.receivers[0])
this_fr_dg = this_result_dg.frequency_response
freqs_dg = this_result_dg.frequency
this_result_ga = res_obj_ga.get_mono_ir(source=sim_ga.sources[0],receiver=sim_ga.receivers[0])
this_fr_ga = this_result_ga.frequency_response
freqs_ga = this_result_ga.frequency
this_result_hyb = res_obj_hyb.get_mono_ir(source=sim_hyb.sources[0],receiver=sim_hyb.receivers[0])
this_fr_hyb = this_result_hyb.frequency_response
freqs_hyb = this_result_hyb.frequency
# plot the comparisons in SPL (db re: 20e-06)
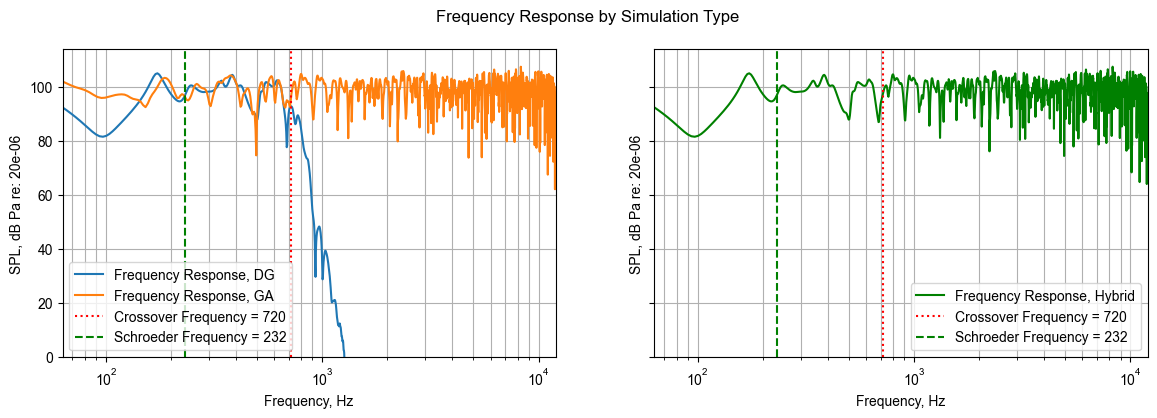
fig, (ax1, ax2) = plt.subplots(1,2,sharex=True,sharey=True,figsize=(14,4))
fig.suptitle('Frequency Response by Simulation Type')
ax1.semilogx(freqs,20*np.log10(np.abs(this_fr_dg)/20e-06),label='Frequency Response, DG')
ax1.semilogx(freqs_ga,20*np.log10(np.abs(this_fr_ga)/20e-06),label='Frequency Response, GA')
ax1.axvline(720,color='r',linestyle=':',label='Crossover Frequency = 720')
ax1.axvline(f_schroeder,color='g',linestyle='--',label='Schroeder Frequency = 232')
ax1.grid(which='both')
ax1.legend()
ax2.semilogx(freqs_hyb,20*np.log10(np.abs(this_fr_hyb)/20e-06),label='Frequency Response, Hybrid',color='g')
ax2.axvline(720,color='r',linestyle=':',label='Crossover Frequency = 720')
ax2.axvline(f_schroeder,color='g',linestyle='--',label='Schroeder Frequency = 232')
ax2.grid(which='both')
ax2.legend()
ax1.set_ylabel('SPL, dB Pa re: 20e-06')
ax2.set_ylabel('SPL, dB Pa re: 20e-06')
ax1.set_xlabel('Frequency, Hz')
ax2.set_xlabel('Frequency, Hz')
ax1.set_xlim([63,12000])
ax1.set_ylim([0,114])