Report view
When clicking the Report view button you enter Report view.
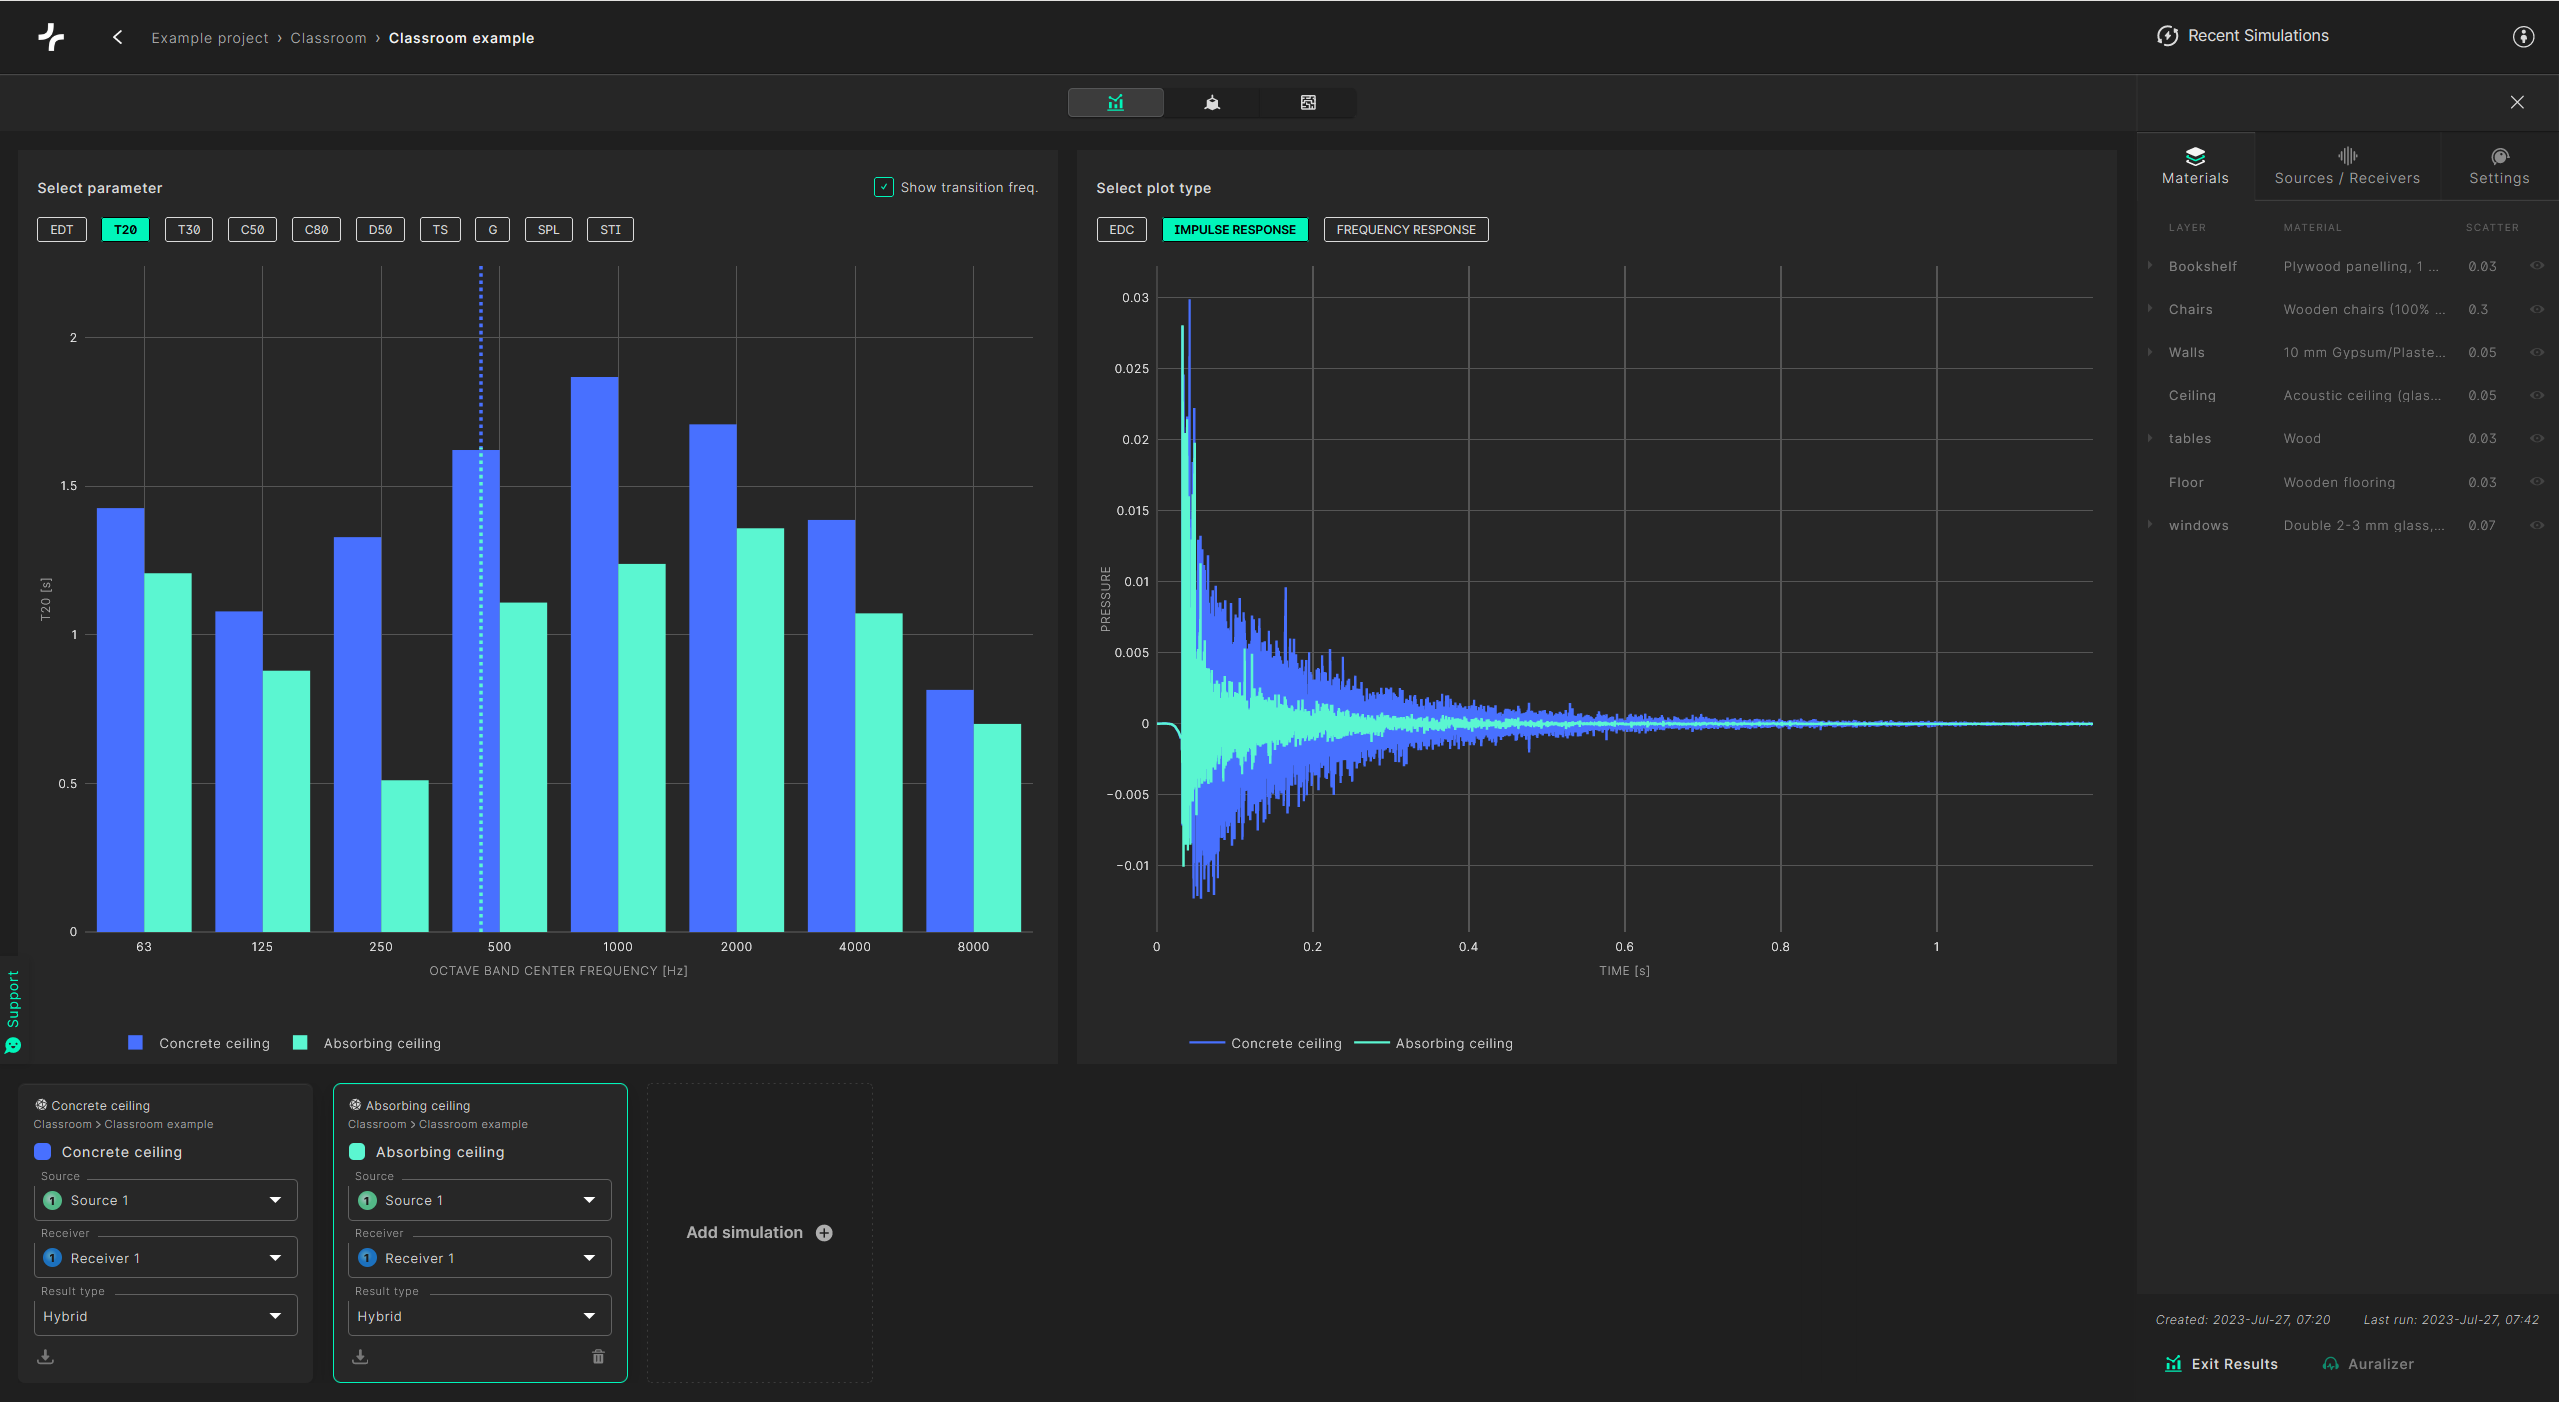
These are the same plots that are also available in the the model view.
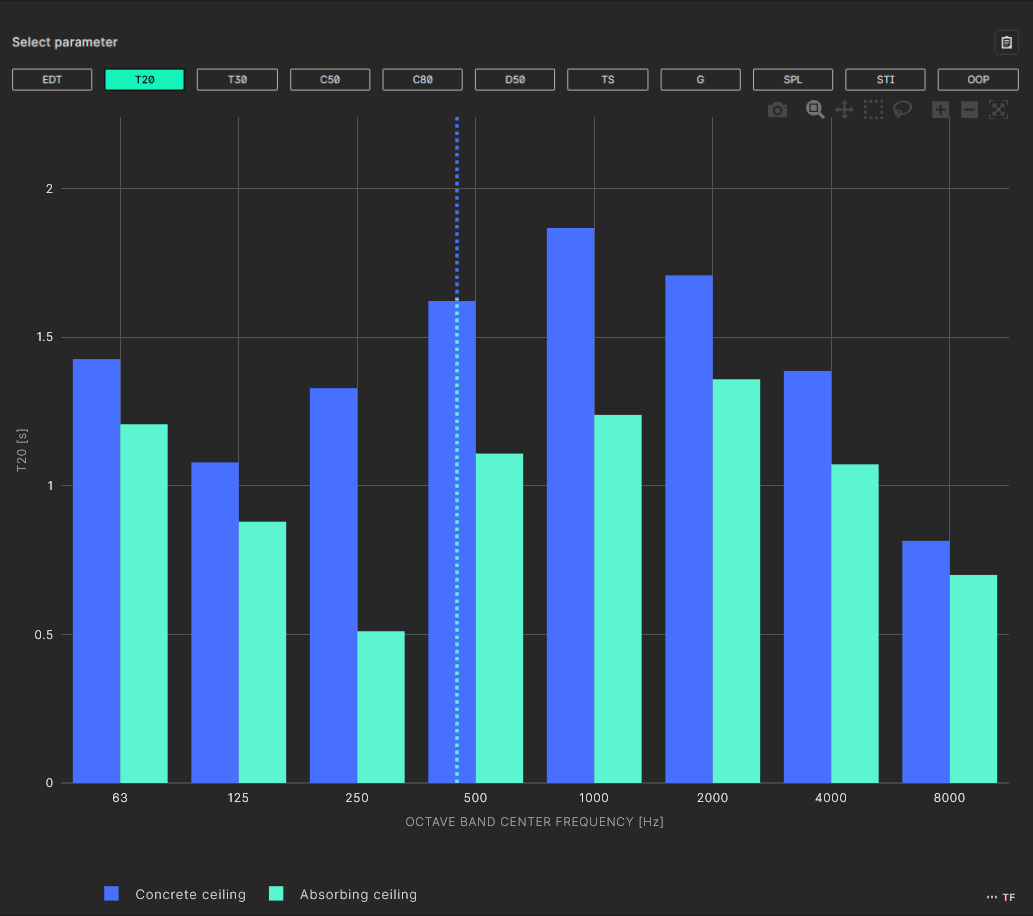
Parameter plots
A selection of acoustic parameters is shown in the results view for each selected source and receiver. The acoustic parameters are derived from the impulse response for each receiver position (according to ISO 3382-1). For detailed description of Acoustic Parameters.
The transition frequency of each simulation is shown in the parameter plots.
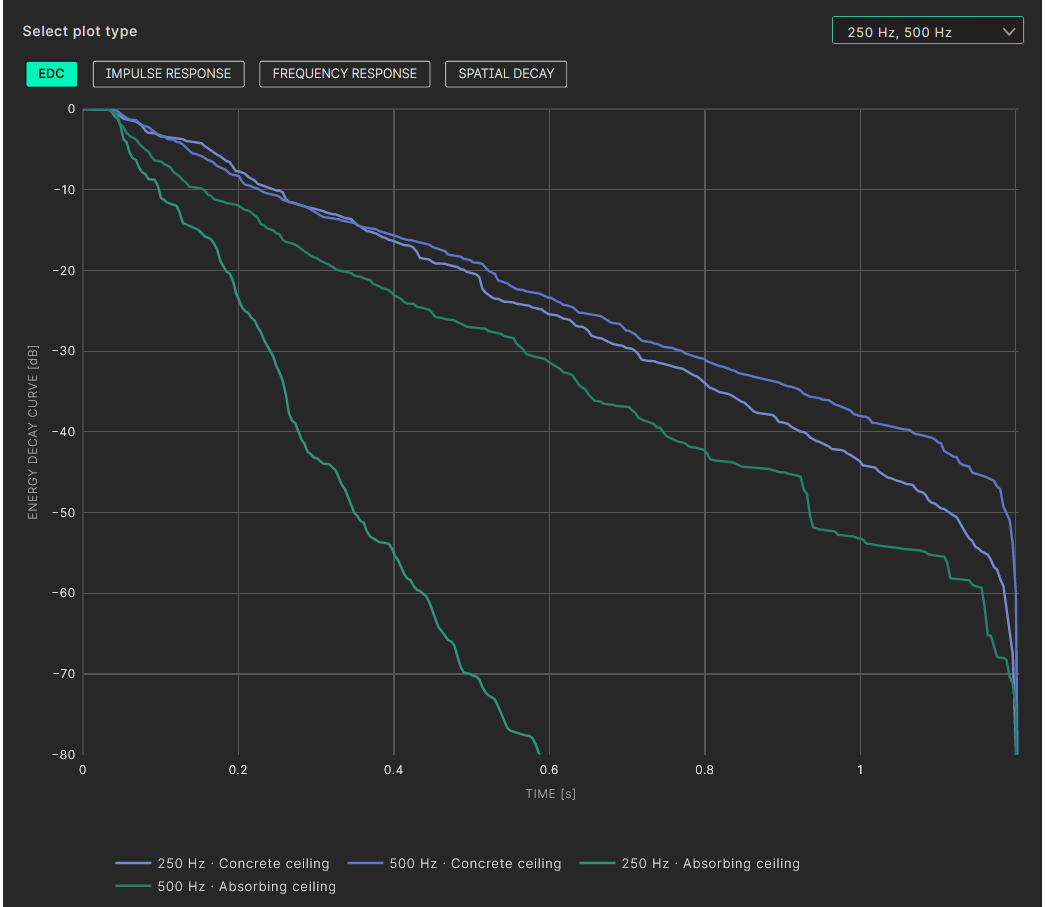
Energy Decay Curve (EDC)
The EDC curve shows how sound energy decays in the room over time at different frequencies. It is computed as the backward integration of the squared impulse response suggested by Schroeder. Thus, EDC is the total amount of signal energy remaining in the impulse response at time t. EDC is the basis data for all the acoustic parameters described above (not entirely correct). Double click on a curve to isolate it. Click on more curves to add them to the comparison plot.
See EDC.
Impulse Response
The impulse response is the sound pressure over time for a given source-receiver pair, when the room is excited with a short impulse.
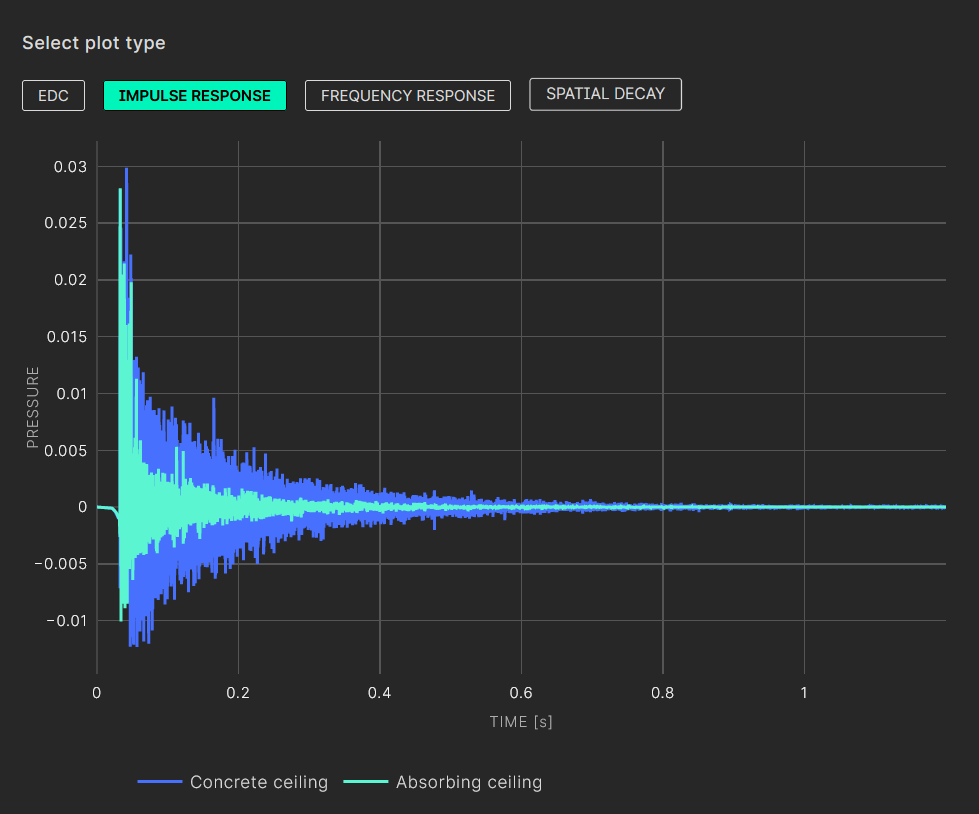
It is possible to auto scale the plot, zoom in and out, pan, and download the plot as a png file.
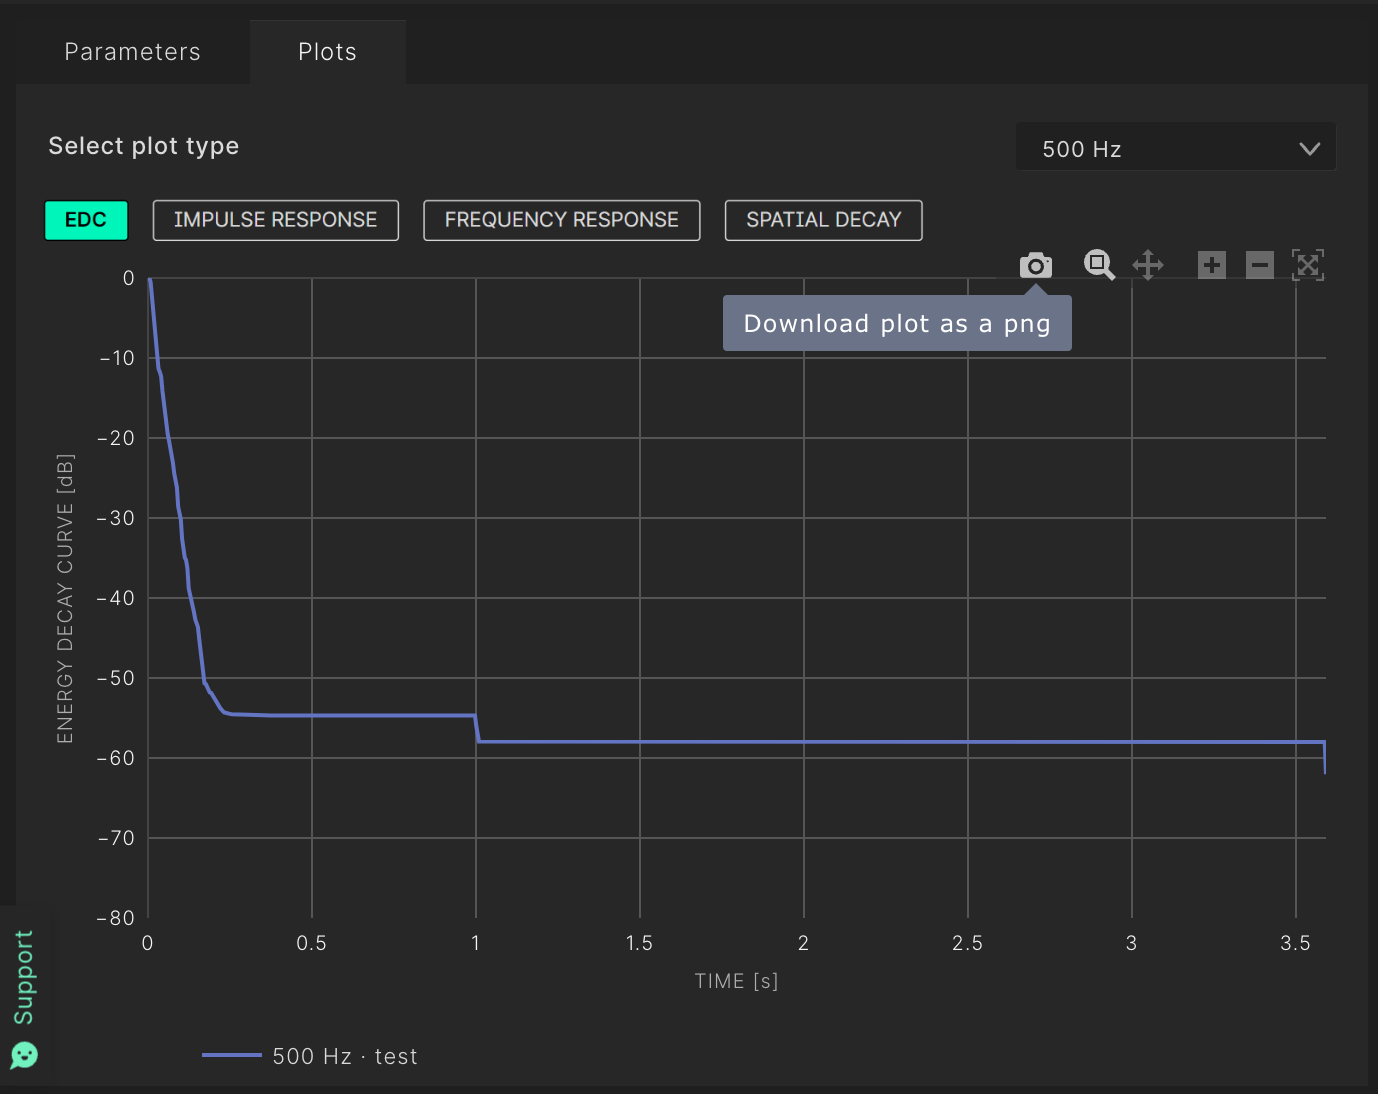
It is also possible to change the axis by clicking on the number value and insert desired number.

Frequency Response
The frequency response is the Fourier transform of the impulse response. It measures the frequency content of the impulse response.
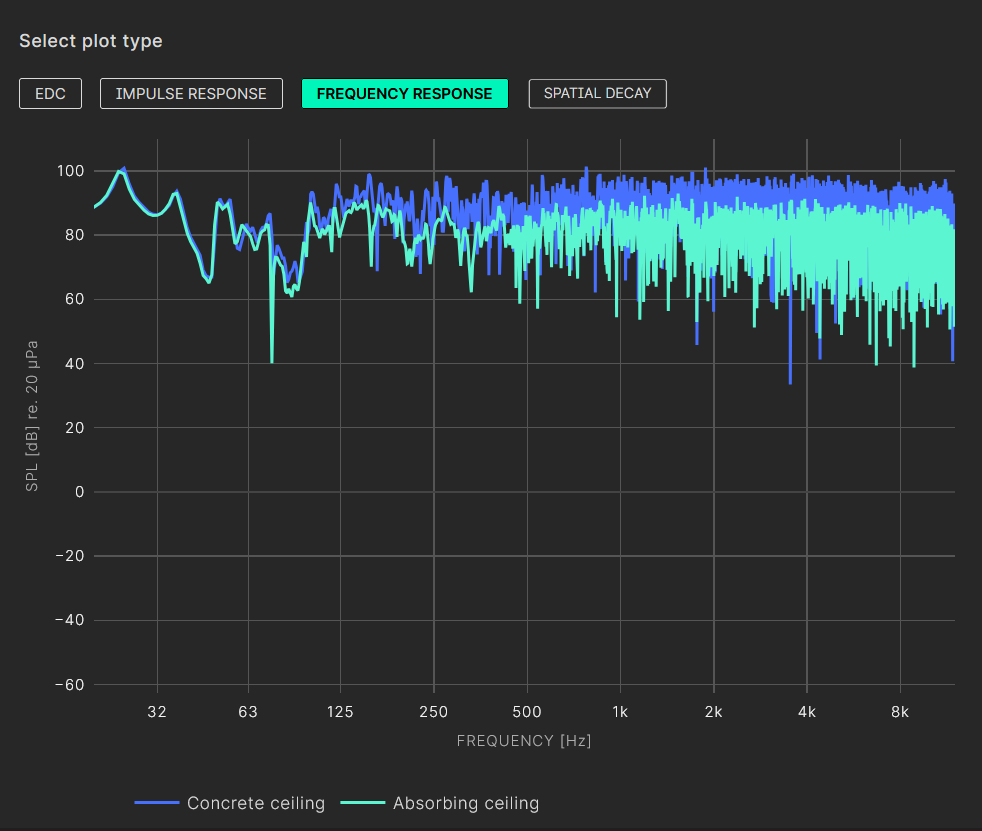
It is possible to highlight a box in the plot to zoom in. Double click the plot to return to the original resolution.
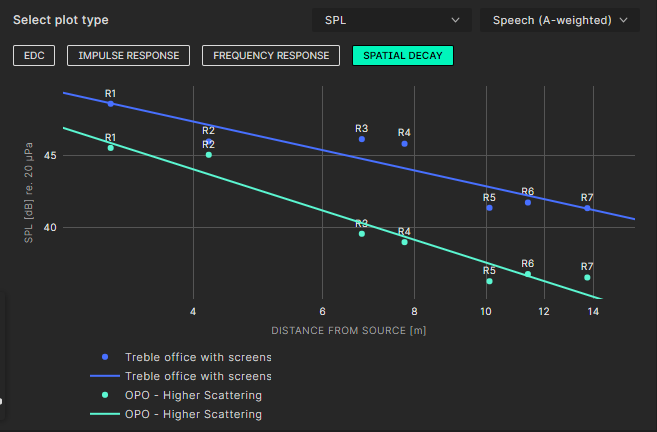
Spatial Decay
The spatial decay plot is designed to visualize the impact of distance from the sound source on various acoustic parameters. To gain meaningful insights from this plot, it is essential to have multiple (ideally all) receivers selected.
For parameters such as Speech Transmission Index (STI) and Sound Pressure Level (SPL), a trendline is added to enhance the visualization of their spatial decay. This feature is particularly useful for analyzing the acoustic characteristics of an open-plan office environment (refer to the Open Plan Office section for more details).
Downloading, scaling, zooming and changing the axis is possible for all plots in Treble.